华慧考博:考博英语图表作文写作指导
图表作文是考博英语里比较常见的一种写作出题方式,它包括有表格(table)和三种图表(chart)即柱形图(bar chart)、饼状图(pie chart)和折线图(diagram)。但不管是chart还是table的写作,它其实都是一种信息转换题,要求考生将图表中的数据信息通过文字的形式表达出来。因而对于图表写作,考生只需将图表所展示出来的内容客观地描述出来,无需再对数据进行推断,展开想象进行拓展。它考查的就是考生的观察和逻辑分析能力,以及对于数字信息的语言表达能力。下面华慧考博老师以一篇图表作文为例。梳理一下图表作文写作思路。
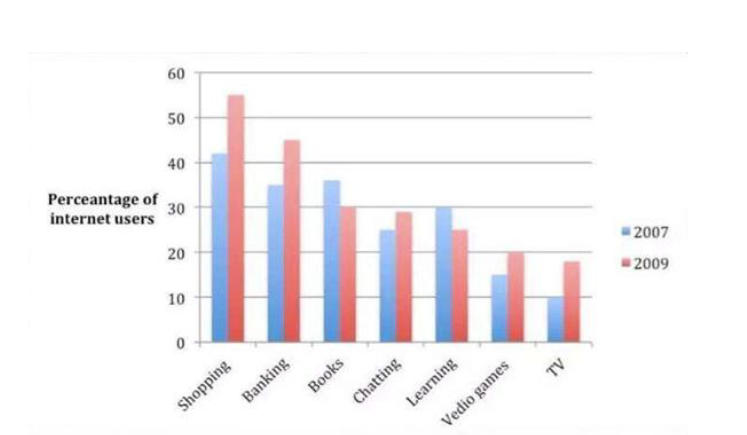
例:The chart below shows the percentage of people using the internet for different activities in a UK city in 2007 and 2009. Describe the information and summarize the pattern. You should write at least 100 words.
Write your essay on your ANSWER SHEET.

第一步,审题。看清作文标题与要求。同一张图表,因命题要求不同,可以写出不同的作文
例如该题目要求是文章要描述图中信息,总结图形模式。文章篇幅不能少于100词。
第二步,观察分析图表。这一步是重点,图表作文的优劣很大程度上取决于考生对图表的观察和分析。观察图表时首先要看是什么图、什么表;搞清楚图表展示的是什么数;各坐标轴、各项目、各变量代表的是什么。其次,考虑选取采取何种方法去分析图表,即逐一描写每一个信息项,或是根据某种联系把所有描写项目加以分组或归类。最后,不同类型的图表都有各自不同的分析思路,且对于各个类型的图表来说,描述不可面面俱到因而分析重点应放在图表里的变化或趋势、各项目对比等重点信息上,根据题目所给图表去采取相应的分析思路,有侧重地去描述总结主题信息。
例如该题为柱状图,展示的是英国某城市在2007和2009年人们上网所从事的各项活动数据对比。横轴表示不同种类的活动,纵轴代表人数百分比,红蓝两色条块代表两个年份。柱状图提供的信息量大,但是数字间的对比很明显,故描写时是以对比为核心的。因而这题的描写重点在两个年份的对比以及纵坐标上的变化和趋势上。写作时可采用分组描写的方法,先归纳出从2007到2009年各活动总的发展趋势(其中有5项红块高于蓝块,2项蓝块大于红块,即从2007到2009,有五项活动人数有增长,两项活动人数有下降);然后对不同活动的数字变化进行分析描述。
第三步,开展写作。在正式下笔前,先确定好文章时态,写作顺序;然后按写作顺序规划段落划分。写作过程中,注意用词准确、句式多变。
如该题描写的是2007年和2009年的数据,需用过去时态。写作顺序就按分析思路顺序,先归纳出从2007到2009年各活动总的发展趋势,然后对不同活动的数字变化进行分析描述。那段落规划可分为:开头段总结主题信息;第2段归纳从2007到2009人数上升的活动项目和人数下降的活动的项目;第3段分别对各个增长活动的具体变化量进行描述;第4段分别对两项下降活动的具体变化量进行描述。文章可这样开展:
The bar chart compares major activities people did on the internet in a UK city in 2007 and 2009.
Overall, more people spent time on online shopping, banking, chatting, video games and TV. The percentage of people reading books and learning online decreased. Online shopping was the most popular at this period.
In 2007, the percentage of people shopping online was the highest and rose to about 55% in 2009. The percentage of online banking users increased from around 35% to 45%. Nearly 25% people (2007) chatted online and it witnessed a growth to almost 30% by 2009. Approximately 15% and 10% of internet users chose to play video games and watch TV online in 2007, and it increased to nearly 20% in 2009.
About 36% and 30% of people preferred reading books and learning on the internet in 2007. These figures experienced a downward trend to 30% and around 26% respectively by 2009.
第四步、检查、润色。检查句子语法、单词拼写、数据是否准确;适当添加逻辑连接词使文章逻辑清晰,句子连贯,行文流畅。如:
The bar chart compares major activities people did on the internet in a UK city in 2007 and 2009.
Overall, more people spent time on online shopping, banking, chatting, video games and TV. By contrast, the percentage of people reading books and learning online decreased. Online shopping was the most popular at this period.
In 2007, the percentage of people shopping online was the highest and rose to about 55% in 2009. The percentage of online banking users increased from around 35% to 45%. Similarly, nearly 25% people (2007) chatted online and it witnessed a growth to almost 30% by 2009. Approximately 15% and 10% of internet users chose to play video games and watch TV online in 2007, and it increased to nearly 20% in 2009.
By contrast, about 36% and 30% of people preferred reading books and learning on the internet in 2007. These figures experienced a downward trend to 30% and around 26% respectively by 2009.
更多考博经验以及考博真题请大家关注华慧考博:www.hhkaobo.com 全国专业考博英语辅导机构。及时为大家更新全国各大院校博士招生简章,收集完善各院校考博英语真题、考博专业课真题等重要考博讯息。专业考博英语辅导团队精心为您打造考博英语复习计划,助力广大考生顺利登岸!

扫描二维码关注华慧考博官方微信公众号
发送消息"6"即可免费领取超值考博资料


